안녕하세요!
Grand Challenge 에서 제공하는 ADM dataset으로 데이터를 분석해보도록 하겠습니다! amd.grand-challenge.org/ 여기에서 회원가입한 후 대회에 참가하면 dataset을 다운로드 할 수 있습니다..ㅎㅎ
AMD dataset은 안구의 중심와(Fovea) 이미지와 Fovea의 중앙 위치(label)로 이루어져 있습니다.
우선, 다운로드 받은 label 엑셀 파일을 pandas로 불러와 확인해보겠습니다.
import os
import pandas as pd

# loading Fovea_location.xlsx
path2data = '/content/cookbook/MyDrive/data'

path2labels = os.path.join(path2data, 'Training400', 'Fovea_location.xlsx')

# make sure to install xlrd
labels_df = pd.read_excel(path2labels, index_col='ID')

# print out its head
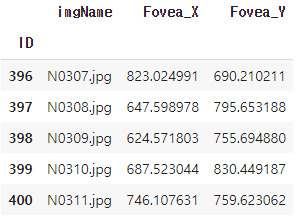
labels_df.head()

imgName와 Fovea의 중앙 위치로 이루어져 있습니다.
끝부분도 확인해보겠습니다.
# print out its tails
labels_df.tail()

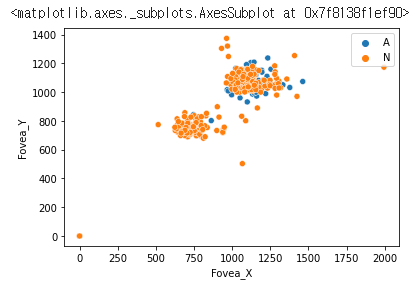
seaborn 모듈에서 제공하는 산점도 그래프로 label을 확인하겠습니다.
# show the scatter plot of the Fovea_X and Fovea_Y coordinates
import seaborn as sns
%matplotlib inline

AorN = [imn[0] for imn in labels_df.imgName]
sns.scatterplot(x=labels_df['Fovea_X'], y=labels_df['Fovea_Y'], hue=AorN)

sample 이미지를 확인해보겠습니다.
그전에, 임의의 index를 지정해 줍시다.
# show a few sample images
import numpy as np
from PIL import Image, ImageDraw
import matplotlib.pylab as plt

# fix random seed
np.random.seed(2019)

# set the plot parameters
plt.rcParams['figure.figsize'] = (15, 9)
plt.subplots_adjust(wspace=0, hspace=0.3)
nrows, ncols=2, 3

# select a random set of image ids
imgName = labels_df['imgName']
ids = labels_df.index
rndIds = np.random.choice(ids, nrows * ncols)
print(rndIds)

이미지와 label을 불러오는 함수를 정의합니다.
AMD dataset에는 AMD 폴더와 Non-AMD 폴더가 있으므로 둘을 구분해주는 기능도 포함합니다.
# define a helper function to load an image and its label from the local files
def load_img_label(labels_df, id_):
    imgName = labels_df['imgName']
    if imgName[id_][0] == 'A':
        prefix = 'AMD'
    else:
        prefix = 'Non-AMD'

    fullPath2img = os.path.join(path2data, 'Training400', prefix, imgName[id_])
    img = Image.open(fullPath2img)
    x = labels_df['Fovea_X'][id_]
    y = labels_df['Fovea_Y'][id_]
    label = (x, y)
    return img, label
Fovea의 위치에 바운딩박스를 그려줍시다. 50x50 크기의 바운딩박스입니다.
# define a helper function to show the image and label as a bounding box
def show_img_label(img, label, w_h=(50, 50), thickness=2):
    w,h = w_h
    cx, cy = label
    draw = ImageDraw.Draw(img)
    draw.rectangle(((cx-w/2, cy-h/2), (cx+w/2, cy+h/2)), outline='green', width=thickness)
    plt.imshow(np.asarray(img))
정의한 함수를 사용해서 이미지를 나타내겠습니다.
# show the selected images together with the fovea bounding boxes
for i, id_ in enumerate(rndIds):
    img, label = load_img_label(labels_df, id_)
    print(img.size, label)
    plt.subplot(nrows, ncols, i+1)
    show_img_label(img, label, w_h=(150,150), thickness=20)
    plt.title(imgName[id_])

조금 징그럽네요...ㅋㅋ
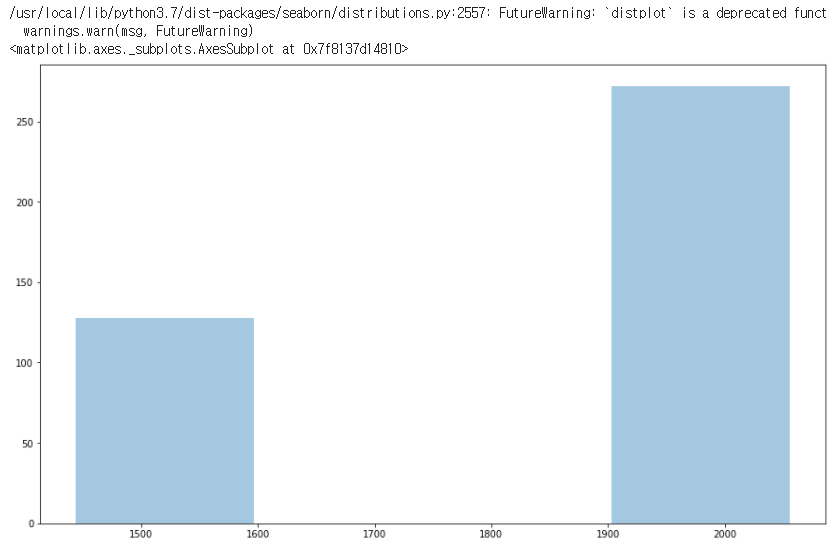
AMD 데이터와 Non-AMD 데이터의 크기는 다릅니다. 분석을 위해서 data의 넓이와 높이 데이터를 그래프로 나타내겠습니다.
우선 높이입니다.
# collect the image widths and heights in two lists
h_list, w_list = [], []
for id_ in ids:
    if imgName[id_][0] == 'A':
        prefix = 'AMD'
    else:
        prefix = 'Non-AMD'
    fullPath2img = os.path.join(path2data, 'Training400', prefix, imgName[id_])
    img = Image.open(fullPath2img)
    h, w = img.size
    h_list.append(h)
    w_list.append(w)

# plot the distributions of heights and widths

# plot the distribution of heights
sns.distplot(a=h_list, kde=False)

AMD data가 더 많으므로 높이가 2056인 데이터가 많습니다.
넓이입니다.
# plot the distributions of widths
sns.distplot(a=w_list, kde=False)

대략적인 데이터 확인은 끝났습니다!
다음 포스팅에서는 image를 transform하고 custom dataset을 만들어보도록 하겠습니다.
'Python > PyTorch 공부' 카테고리의 다른 글
| [PyTorch] data augmentation(resize, flip, shift, brightness, contrast, gamma) 함수 정의하기 (0) | 2021.03.06 |
|---|---|
| [PyTorch] 이미지 크기와 바운딩박스 좌표를 resize 하는 함수 정의 (0) | 2021.03.06 |
| [PyTorch] ResNet, pre-trained 모델 불러오기 (0) | 2021.03.01 |
| [PyTorch] 이미지 픽셀의 평균, 표준편차를 계산하여 정규화하기 (1) | 2021.02.28 |
| [PyTorch] dataset 분할하기 (2) | 2021.02.28 |