이번 포스팅에서는 10개의 카테고리을 지닌 데이터셋을 각 카테고리간 동일한 비율로 데이터를 갖도록 분리해보겠습니다.
사용하는 데이터셋은 STL-10 dataset입니다. STL-10 dataset은 10개의 카테고리로 이루어져 있으며, train과 test dataset을 제공합니다. val dataset을 제공하지 않기 때문에 test dataset을 분할하여 val dataset을 만들어보도록 하겠습니다. 작업 환경은 colab에서 진행했습니다.
분할에 이용하는 함수는 sklearn 모듈의 StratifiedShuffleSplit 함수입니다.
STL-10 dataset 불러오기
파이토치의 torchvision 패키지에서 제공하는 STL-10 dataset을 불러옵니다.
STL-10 dataset은 96x96 크기의 RGB 컬러 이미지이며, 5000개 train 이미지, 8,000개 test 이미지를 포함하고 있습니다.
1. traing data 불러오기
# loading training data
from torchvision import datasets
import torchvision.transforms as transforms
import os
path2data = '/data'
# if not exists the path, make the path
if not os.path.exists(path2data):
os.mkdir(path2data)
data_transformer = transforms.Compose([transforms.ToTensor()])
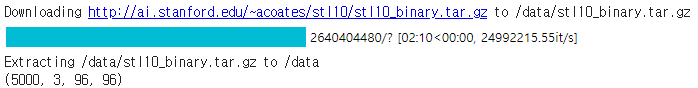
train_ds = datasets.STL10(path2data, split='train', download='True', transform=data_transformer)
print(train_ds.data.shape)
2. train_ds의 카테고리에 있는 이미지의 수를 확인합니다.
# count the number of images per category in train_ds
import collections
y_train = [y for _,y in train_ds]
counter_train = collections.Counter(y_train)
print(counter_train)

3. test dataset을 불러오고 test0_ds에 저장합니다.
# load test dataset and call it test0_ds
test0_ds = datasets.STL10(path2data, split='test', download=True, transform=data_transformer)
print(test0_ds.data.shape)
dataset 분할하기
1. test0_ds의 인덱스를 두 그룹으로 분할합니다.
STL-10 dataset에 validation data가 없으므로, validation data를 만들어야 합니다.
sklearn 모듈의 StratifiedShuffleSplit 함수를 사용하면 각 카테고리당 동일한 수의 이미지로 분할됩니다.
# split the indices of test0_ds into two groups
# there aren't validation data in STL10 dataset, so make validation data
from sklearn.model_selection import StratifiedShuffleSplit

# StratifiedShuffleSplit sample the data in same proportion of labels
sss = StratifiedShuffleSplit(n_splits=1, test_size=0.2, random_state=0)

indices = list(range(len(test0_ds)))
y_test0 = [y for _, y in test0_ds]

for test_index, val_index in sss.split(indices, y_test0):
    print('test:', test_index, 'val:', val_index)
    print(len(val_index), len(test_index))
2. test0_ds로부터 두 dataset을 생성합니다.
torch.utils.data에 있는 Subset 함수를 사용하여 데이터셋을 생성합니다.
Subset 함수를 이용하여 데이터셋을 생성하면, 부모set이 업데이트 됬을 때, subset도 함께 업데이트 됩니다.
# create two datasets from test0_ds
from torch.utils.data import Subset

# if test0_ds is updated, val_ds and test_ds are updated.
# because val_ds and test_ds are a subset of train_ds
val_ds = Subset(test0_ds, val_index)
test_ds = Subset(test0_ds, test_index)
test0_ds가 업데이트되면 Subset인 val_ds와 test_ds도 함께 업데이트 됩니다.
3. val_ds와 test_ds의 카테고리당 이미지수 확인하기
# count the number of images per class in val_ds and test_ds
import collections
import numpy as np

y_test = [y for _, y in test_ds]
y_val = [y for _, y in val_ds]

counter_test = collections.Counter(y_test)
counter_val = collections.Counter(y_val)
print(counter_test)
print(counter_val)
train dataset과 validation dataset의 이미지 확인하기
몇 개의 이미지를 뽑아서 확인해보겠습니다.
# show a few sample images from train_ds.
from torchvision import utils
import matplotlib.pyplot as plt
import numpy as np
%matplotlib inline

np.random.seed(0)

# define helper function
def show(img, y=None, color=True):
    npimg = img.numpy()
    npimg_tr = np.transpose(npimg, (1,2,0))

    plt.imshow(npimg_tr)
    if y is not None:
        plt.title('labels: ' + str(y))

# pick random samples
grid_size = 4
rnd_inds = np.random.randint(0, len(train_ds), grid_size)
print('image indices:', rnd_inds)

# create a grid from the sample images
x_grid = [train_ds[i][0] for i in rnd_inds]
y_grid = [train_ds[i][1] for i in rnd_inds]

x_grid = utils.make_grid(x_grid, nrow=4, padding=1)
print(x_grid.shape)

plt.figure(figsize=(10.0, 10.0))
show(x_grid, y_grid)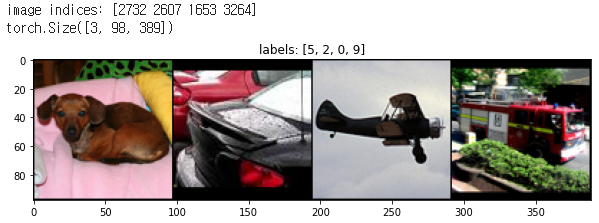
# sample images from val_ds
np.random.seed(0)

grid_size = 4
rnd_inds = np.random.randint(0, len(val_ds), grid_size)

x_grid = [val_ds[i][0] for i in rnd_inds]
y_grid = [val_ds[i][1] for i in rnd_inds]

x_grid = utils.make_grid(x_grid, nrow=4, padding=1)

plt.figure(figsize=(10,10))
show(x_grid, y_grid)

'Python > PyTorch 공부' 카테고리의 다른 글
| [PyTorch] ResNet, pre-trained 모델 불러오기 (0) | 2021.03.01 |
|---|---|
| [PyTorch] 이미지 픽셀의 평균, 표준편차를 계산하여 정규화하기 (1) | 2021.02.28 |
| [PyTorch] convolutional layer 출력 크기 계산하는 함수 만들기 (0) | 2021.02.22 |
| [PyTorch] 암 이미지로 커스텀 데이터셋 만들기(creating custom dataset for cancer images) (0) | 2021.02.22 |
| [PyTorch] CNN 신경망 구축하고 MNIST 데이터셋으로 학습하기 (1) | 2021.02.14 |